
Market Thesis in Practice
How to Identify Your Economic Concentration

This is Article 6 in the Economic Architecture series — the applied companion to last week’s doctrine piece on Market Thesis. If you missed it: Article 5 defined what a Market Thesis actually is and why concentration beats dispersion. This week: how to find yours in the data you already have.
Most companies don’t choose their Market Thesis from a whiteboard.
They discover it, usually late, usually after years of growing in directions that felt opportunistic at the time. They see it in a cluster of customers that converts faster than the others, a segment where churn is structurally lower, or a vertical where expansion happens without prompting and where customers add seats and products because the value compounds for them automatically.
The data is almost always there before the decision is made to focus on this/these segments. The problem is that most organizations aren’t looking for the pattern. They’re looking at the top of the funnel: new logos, new segments, new geographies, and the concentration hiding in their existing customer base goes unexamined.
This week: I am helping you to find your Market Thesis from your data.
Why Most Companies Look in the Wrong Direction
I have run Growth teams, on the product side, for years so I think I know a lot about this topic. The default mental model for growth in many companies is acquisition. More customers, more segments, more markets. Revenue conversations almost always start with the question: where can we find more buyers?
It is the wrong question, almost universally.
Not because acquisition doesn’t matter: it does. But because the answer to where your market thesis lives is almost never in the segments you haven’t cracked yet. It’s in the ones you’ve already cracked and haven’t examined closely enough.
Here is the pattern I have seen repeatedly:
A company grows to €5–15M ARR across several customer types
Retention is decent but not exceptional, NRR hovers around 100–110%, which feels respectable
Expansion happens but it doesn’t follow a predictable pattern
Churn is distributed: it happens in every segment, for different reasons, which makes it hard to learn from.
Then someone runs a cohort analysis cut by vertical, or by company size, or by use case and the data looks completely different depending on which slice you’re in.
One segment has 130% NRR, low churn, fast time-to-value, shorter sales cycles. Another has 95% NRR, higher churn, longer onboarding, more support tickets. The aggregate number was hiding the fact that one segment was compounding and another was eroding.
That’s the discovery moment!
The strategic question was never “where should we go?” It was “where are we already winning, and why?”.
I have seen this first hand at Typeform: exceptional Growth for year but without real understanding of where it came from. when I joined it was slowing down severely though and retention/churn was not good. When I ran an analysis of key metrics per Role Type & Job-to-Be-Done, one segment was standing out: Marketers doing Lead Generation. Though only 2% of sign-ups, their conversion rate to paid customers was 2x better than the next sign-up segment, retention was also better by a good margin (though not exceptional in absolute, signaling a problem on our product fit).
The signs were there: we did have a segment of customers on which to focus on. The problem was people were focused on pouring by all means more sign-ups w/o discrimination. The second problem was the segment was small in the actual cohorts and their ACV was not large because we charged per answers and lead generaiton is not necessarily the use case driving the most volumes. So the company was scared to invest into this as the path to revenue growth seemed hard: get more traffic to increase revenue felt the only option while actually building a product we could monetize better was the real answer1.
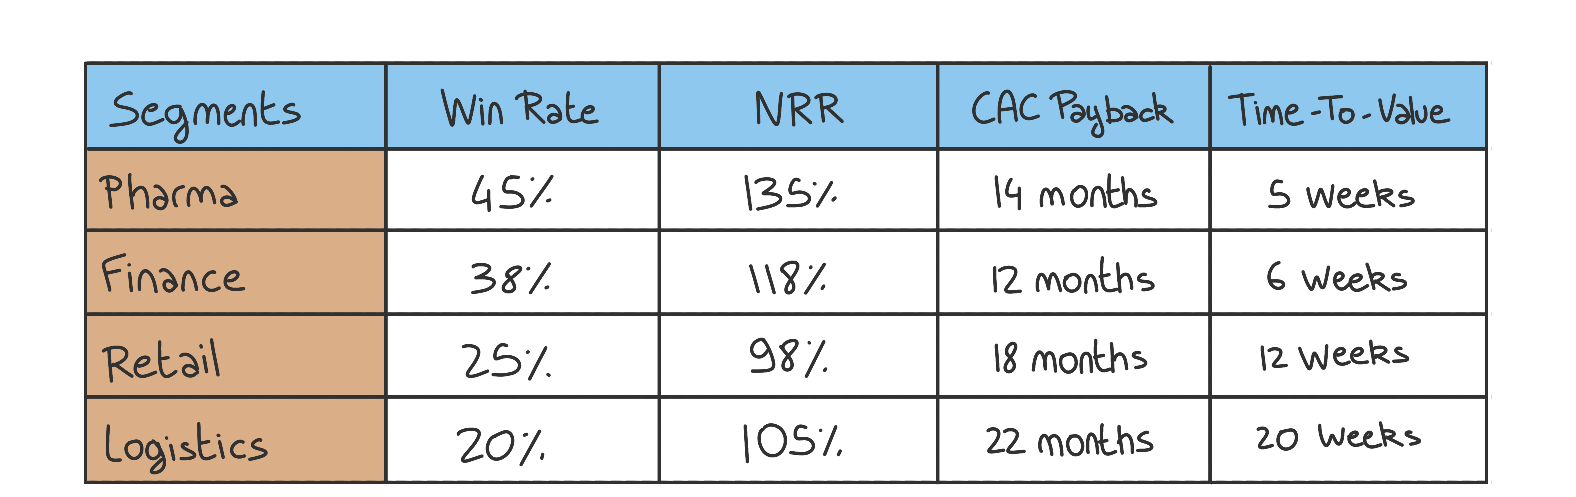
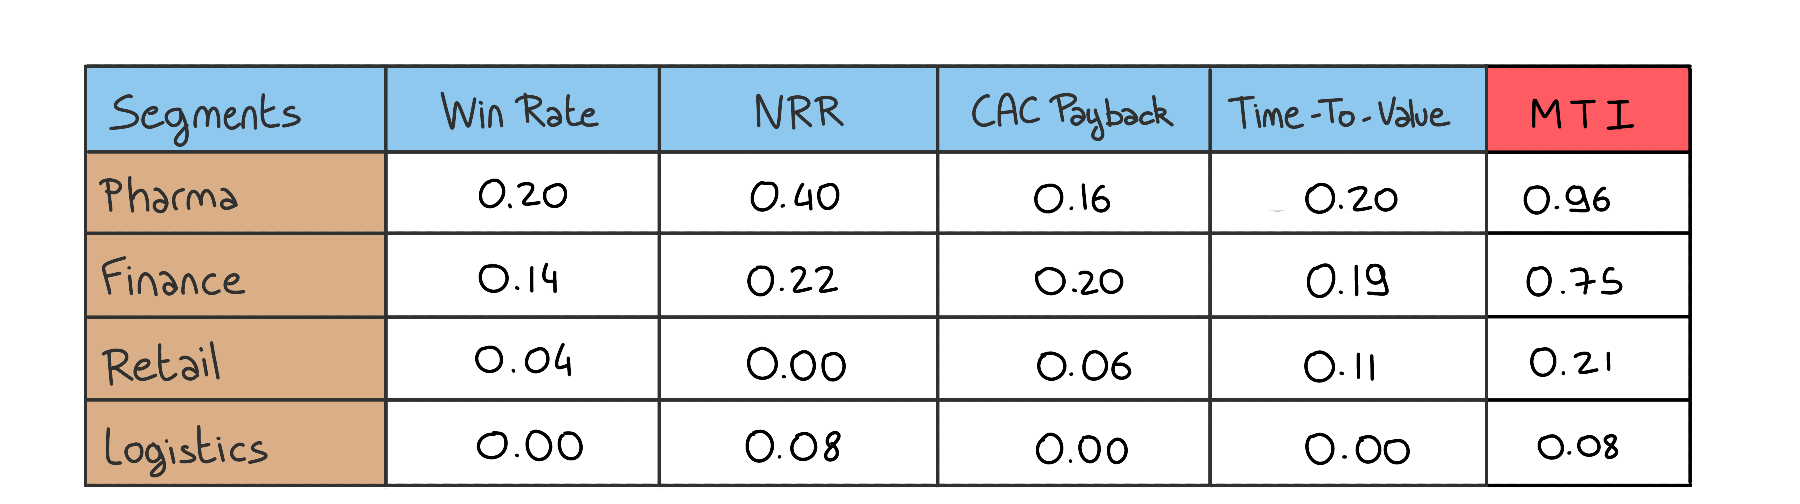
For example the Win Rate sub_score for the Finance segment is 20% (Weight) * (38% - 20%)/(40%-20%) = 0.144 (rounded to 0.14).
The result is unambiguous. Pharma is the core segment where all four components align. Finance is a strong candidate solid across the board but NRR is weaker. Retail looks passable on TTV and win rate but its NRR at 98% reveals that customers aren’t growing; whatever value the product creates isn’t compounding. Logistics has no systematic advantage on any dimension.
Reading the score
75-100 — Thesis Grade Structural advantage is present. Concentrate here
50-74 — Structural Candidate Promising on most dimensions. Investigate the compounding mechanism before committing
25-49 — Opportunistic Competitive on some dimensions, not structural. Serve opportunistically; don’t concentrate investment
0-24 — Contested Ground No systematic advantage. Revenue here is hard-won and doesn’t compound.
One hard floor
Any segment where NRR falls below 100% is capped at Opportunistic (maximum score of 49), regardless of its MTI calculation. Customers who are contracting — spending less over time — signal that value delivery isn’t sufficient for structural advantage. You may still win deals and onboard quickly in that segment, but if customers don’t expand, the economics are extractive rather than compounding. A market thesis cannot be built on a contracting customer base. Too manny companies fall into this trap though. The main problem is you end up combing a segment base pouring millions of $ into getting them to contract with your services but upon time loosing most. The poster child for a leaky bucket.
In the example above, Retail’s NRR of 98% would trigger this floor regardless of its raw MTI score.
What the MTI doesn’t tell you
The MTI identifies which of your existing segments shows the structural pattern. It does not tell you whether your best segment is good enough in absolute terms to sustain a thesis. A segment can score 100 on the MTI while still being too small, too slow-growing, or too capital-intensive to warrant full concentration.
Use the MTI as the first filter — it tells you where to look. Then run Diagnostics 2 and 3 to understand whether the structural advantage in that segment is real and whether winning compounds.
Diagnostic 2: Where does your product create value that alternatives can’t replicate?
This is the economic problem test from last week, applied inward.
For each segment where your performance is strong, ask: what would happen if we disappeared? Not “what would customers miss?” The sharper version: what problem would resurface, and how expensive would it be to solve it another way?
If the answer is “they’d use a competitor with similar capabilities”, you have a product advantage, not a structural one. You’re winning because of quality, not architecture. That’s valuable but fragile: a better-funded competitor, a better-designed feature, a lower price point can erode it.
If the answer is “they’d have to rebuild something from scratch, or stitch together three tools that don’t talk to each other, or give up compliance requirements that are non-negotiable” then you have structural advantage. That’s what a market thesis is built on.
Diagnostic 3: Where does winning compound?
This is the test that separates a strong segment from a market thesis.
In any segment where you perform well, ask: does winning customer 50 make winning customer 51 easier, and *why specifically*?
The mechanisms are finite:
Reference density: customers in this vertical know each other. A win at one becomes evidence at the next prospect before any sales effort is spent. If amazon uses your product I am pretty sure every ecommerce platform will want to use your services as you are “the standard”. For B2C Referral/Virality is the pendent item.
Data advantage: every customer makes your product smarter in ways that are specific to this vertical. Your model improves, your benchmarks sharpen, your recommendations become more precise. At Veriff, our ML models become smarter with more cases of Identity verification and fraud they are exposed to.
Switching cost depth: the longer a customer uses your product, the harder migration become, not because you’ve locked them in contractually, but because the operational integration has deepened to the point where replacement requires rebuilding infrastructure.
Network effects: customers in this segment need to interact with each other inside your product. Adding more customers makes the product more valuable to every other customer.
Looping back on Typeform’s example
As we have seen above, while I was at Typeform the company struggled because of its historical growth on an horizontal Product. Good enough to reach $50M ARR, not good enough to bring us to $100M and way beyond. The problem with the horizontal product is that it served all segments and none really well. Features piled up organically depending on the teams focus or semi-random signals from some segments. This led to plans that were hard to read:
Many advanced features on more expensive plans were needed only from few segments of customers leaving the other believing they would pay for things they don’t use
Complexity to understand value scaling between plans anchored the price point on responses leading to a very harsh evaluation: are 100 responses on the lower plan worth €35 a month when Google form is for free?
Advanced users for whom collecting responses from their users was business critical were left with a product partially solving their problem:
Product customers needed more analysis capabilities
Researcher looked for randomization and A/B tests
Marketers more enrichment and lead scoring capabilities + Workflows enablement
HR managers were in the search of industry benchmarks and randomization…
The data showed Marketers, especially the ones doing Lead Generation activities had a keen interest in our product. Yet, we would not provide a true solution to their Growth objectives. Once the company set to finally focus on this segment after 2 years of shilly-shallying, a bit before I left, it set to buidl a dedicated plan for this Market.
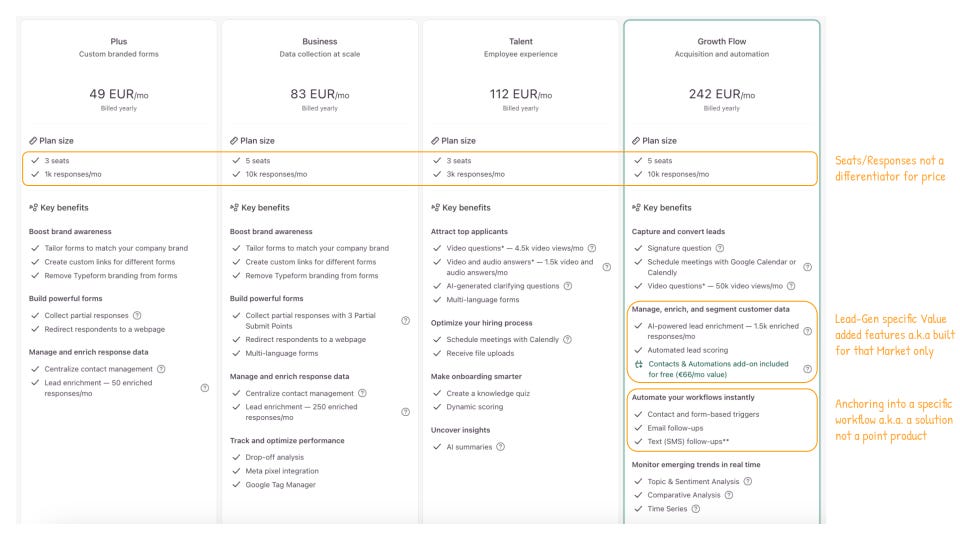
The Growth Plan is currently priced much higher than any other plan. Yet it contains the same umber of seats and responses as the Business Plan. Old Typeform growth thesis was solely based on these 2 factors. But choosing a new Market Thesis, a focused one, allowed the company to depart from this value evaluation and focus on higher value added services it could provide such as Data Enrichment and Workflows enablement to extract a fairer amount of value from its customers based on the service it would provide. History will tell if this choice will pay out!
Recognizing Your Concentration
Here is the practical synthesis.
If you run the three diagnostics and the same segment appears at the top of every one — high economic performance, structural value creation, a clear compounding mechanism — you have identified your economic concentration. The thesis is already implicit in your business. The job now is to make it explicit: articulate it, commit to it, and build your next planning cycle around deepening it rather than spreading beyond it.
If different segments appear at the top of different diagnostics — you have strong performance here but no compounding, structural value there but weak economics — the picture is more complex. Often this means you have a partial thesis: a good vertical and a good economic problem, but no wedge. Or a strong wedge and strong compounding, but in a segment that is too small to build a business around.
The work in that case is not to abandon the exploration. It is to run the three diagnostics more deliberately — segment by segment, product by product — until the intersection becomes visible.
And if the data genuinely doesn’t point anywhere? If every slice of your customer base looks roughly equivalent — similar win rates, similar NRR, similar CAC payback — then you likely have a positioning problem upstream of the thesis. You haven’t built enough depth in any direction for differentiation to show up in the metrics yet.
That is a harder problem. But it is a solvable one. It starts with the same question: where, in your existing customer base, is the seed of concentration that you haven’t chosen to water yet?
PS: It’s Monday — are you on top of last week’s performance?
If you are skipping your Weekly Business Review, lost in dashboards, or unsure why metrics move, you’re not alone.
📘 The Power of Analytics is your guide to choosing the right metrics and building a system to truly and easily understand product performance and customer behavior.
👉 Stop wasting your time and grab your copy [here]
Typeform went back on its assessment and finally made the call to focus on Marketers in 2023, leading to a Growth Plan being built specifically for this segment.